PREMISE

Thousands of operators work on assembly lines on the manufacturing floor at various locations of a large manufacturing company. The company had no definitive measure to assess efficiency and quality at various levels—organizational, team and individual—and to identify “masters” or trainers vs learners or trainees. Assessment was made even more difficult by a high attrition rate. The challenge was to do all this even though operator-specific data was not available!

SOLUTION

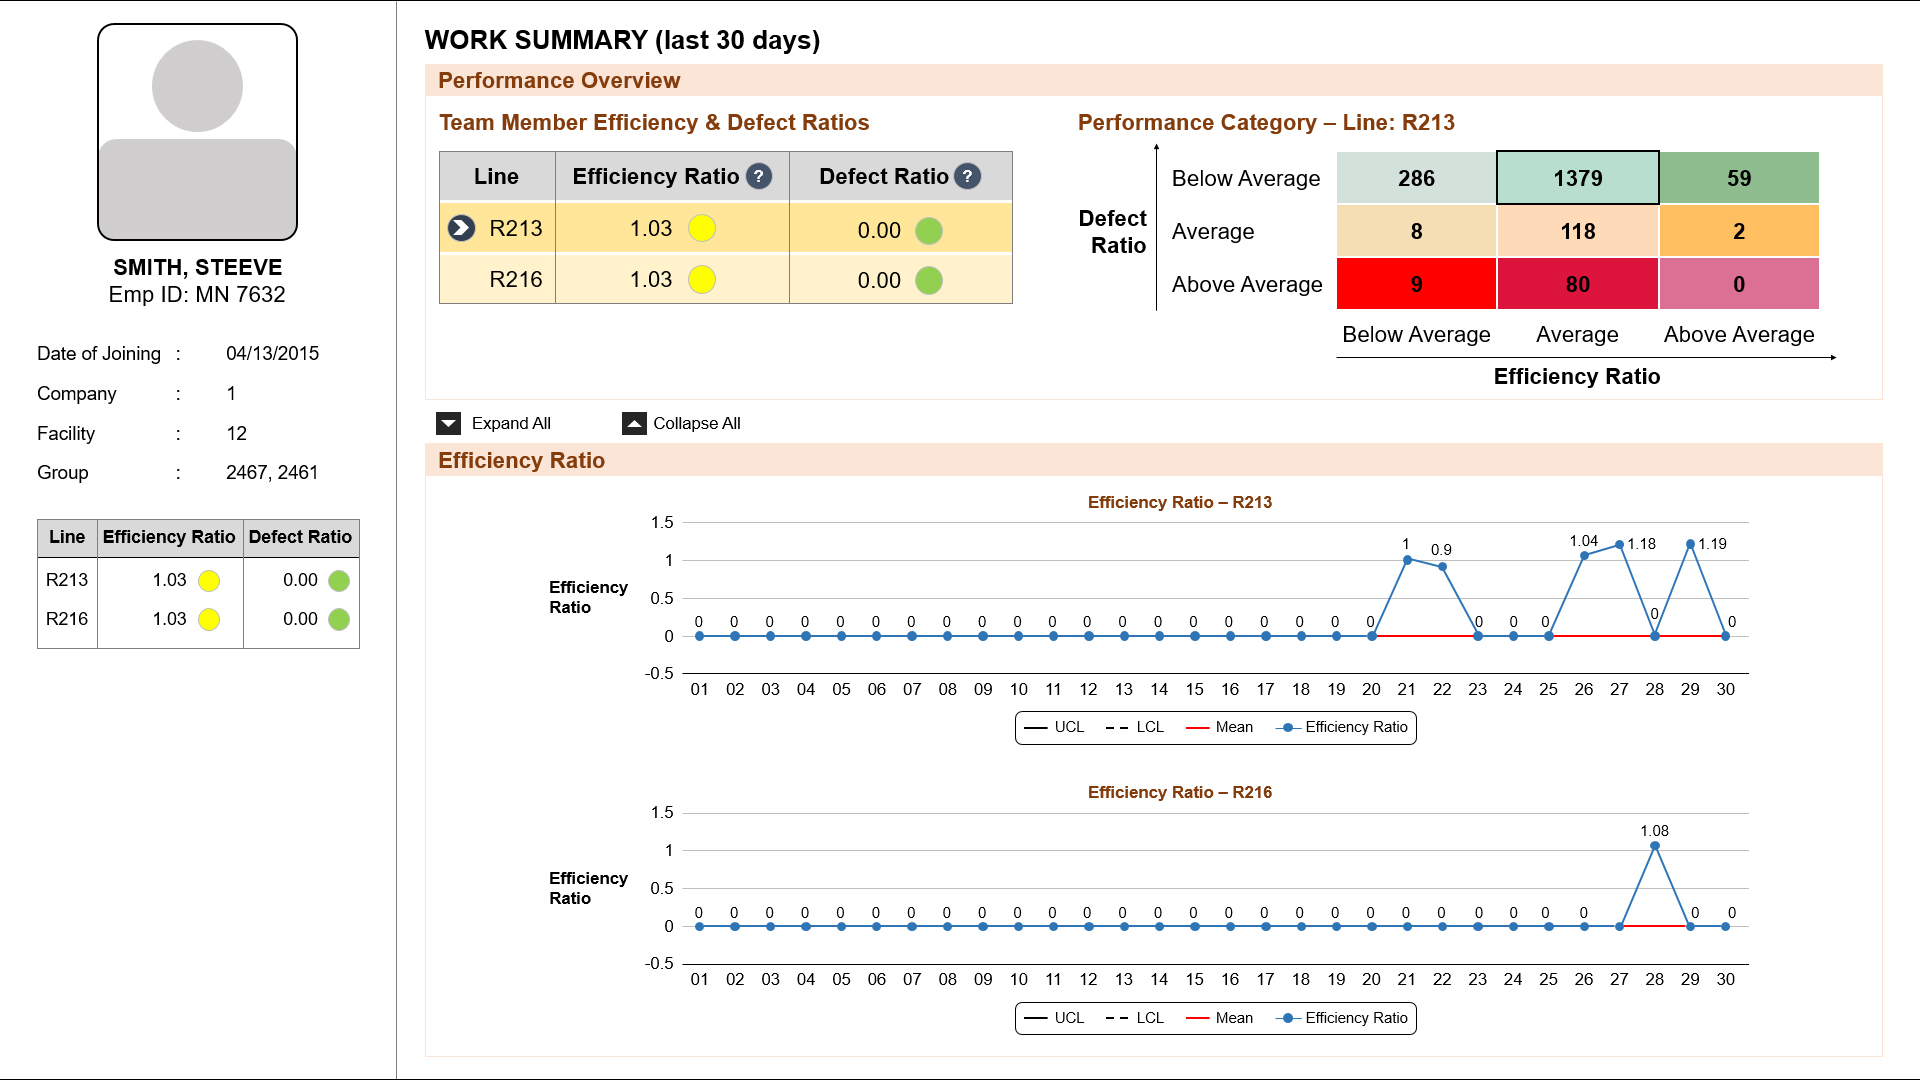
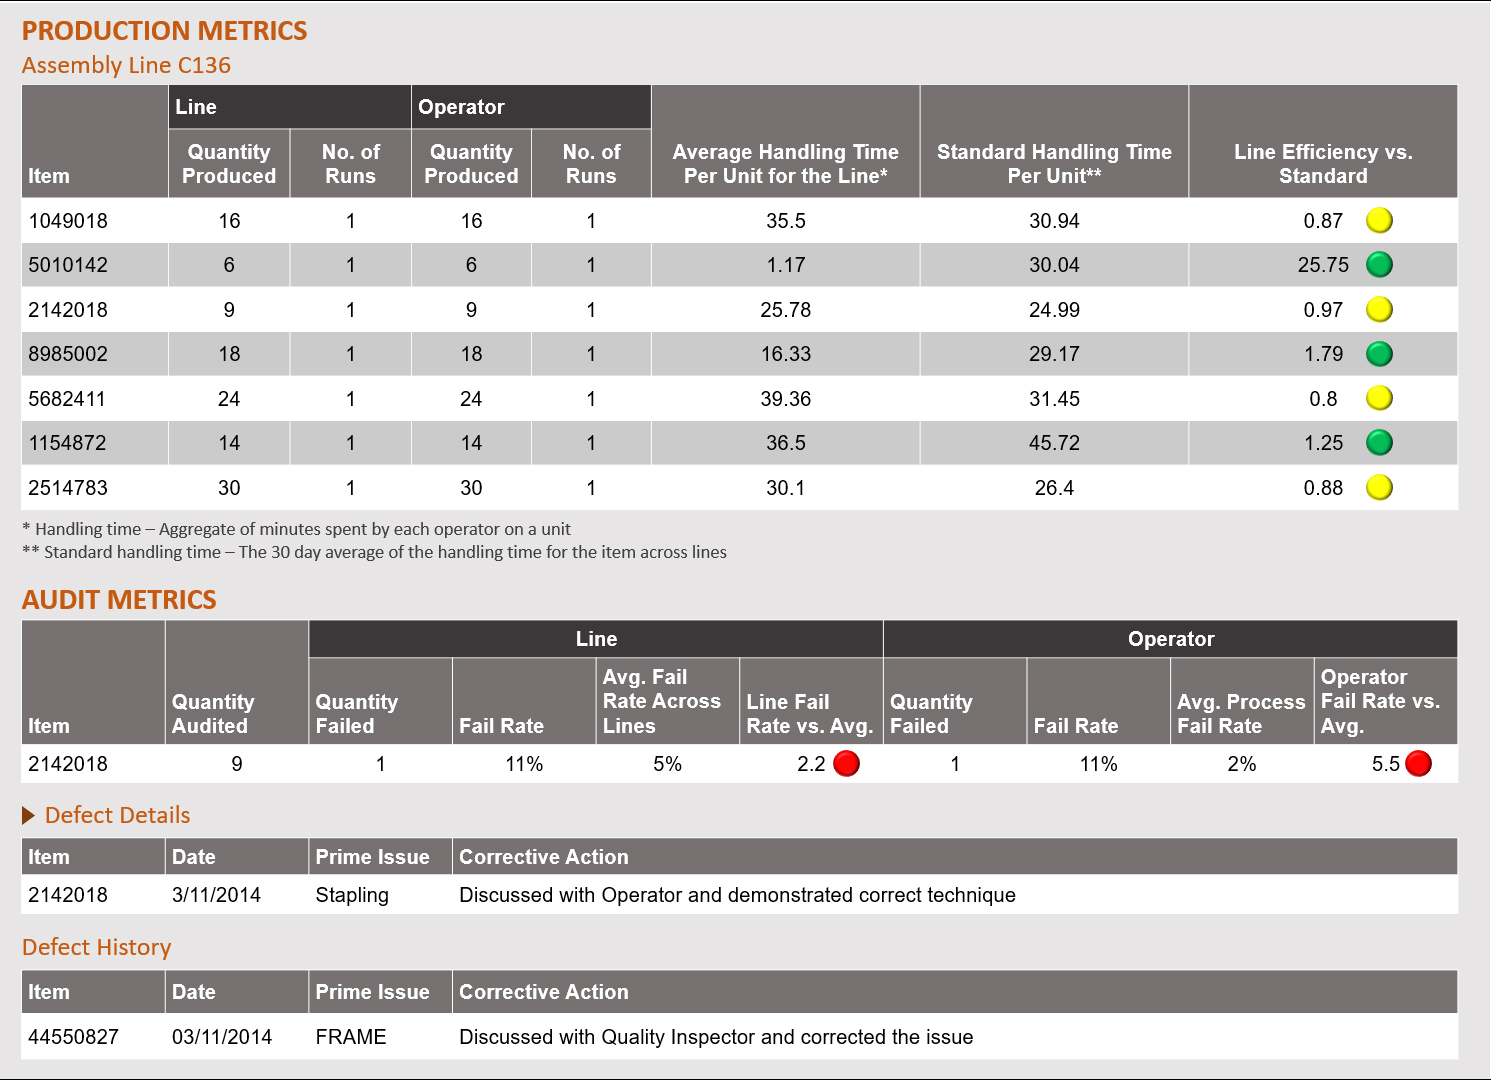
Customer Analytics created a “scorecard” to assess efficiency and quality at operator, team, supervisor and above levels. This was based on production run data from which measures relating to efficiency, such as handling time, were created. Defect-related data were used to derive quality metrics.

Team Member Performance Summary

ACTION

Customer Analytics began by deriving measures such as number of production runs and time taken to complete each run and using these to derive metrics such as average handling time, actual handling time and efficiency ratio. Red / yellow / green indicators were used on the scorecards to show how an individual’s or team’s efficiency ratio compared to the average. Similar indicators showed the comparison of defect ratio to the average. Based on these ratios, operators were categorized into buckets such as high efficiency–low defect (masters/trainers), low efficiency–low defect (learners / trainees), average efficiency–average defect, etc. Based on the number of operators in each bucket, it was possible to show an overall picture at higher levels of the organization.

Efficiency & Defect Details

RESULT

This in-depth profiling helped measure performance and check attrition, with performers being rewarded and training needs being met to get better efficiency and quality.